Sometimes we need to remove outliers from data. In this tutorial, we learn how to remove outliers from data including multi-variables, a single variable and data by group in R. Find out how to remove outliers from data in R.
Removing outliers from data is not general procedure since outliers affect the model in positive or negative way. Data scientists often consider over outliers while working with datasets. It is essential to deal with them since they significantly affect a statistical model.
In this tutorial, we learn how to remove outliers in the following three situations. Firstly, we learn how to remove outliers from data including multi-variables in R. Secondly, we go over how to remove outliers from a single variable. At last, we work on how to remove outliers from data by group in R.
1) How to Remove Outliers from Data Including Multi-Variables in R
In this part, we use iris data to learn how to remove outliers from data which involve multiple variables.

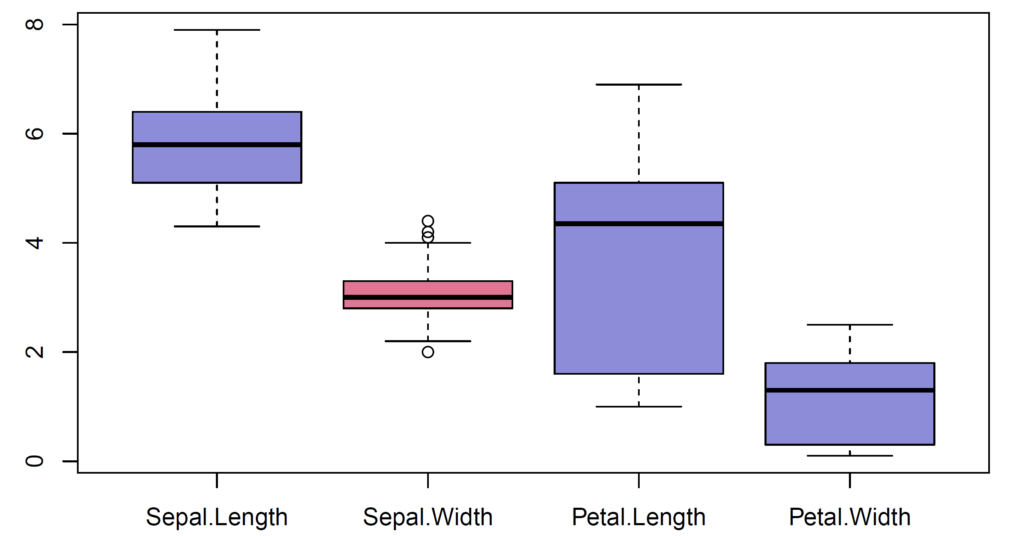
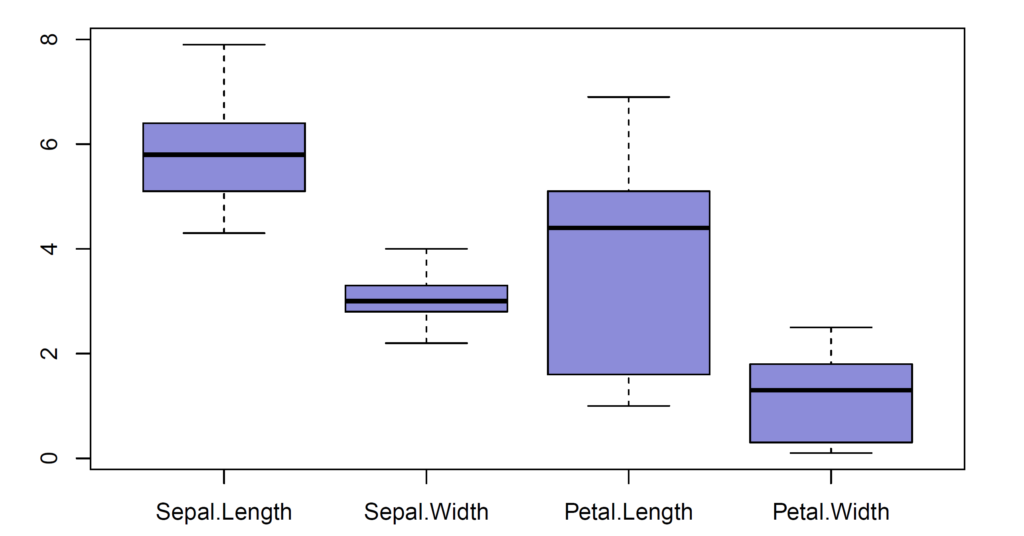
In our case, we select the quantitative variables from iris data. We have four variables – sepal length, sepal width, petal length and petal width and 150 observations. There exist four outliers seen in sepal width variable.
The outliers can be shown by boxplot() function. We find first (Q1) and third (Q3) quartiles by using quantile() function. Then, interquartile range (IQR) is found by IQR() function. Moreover, we calculate Q1 – 1.5*IQR to find lower limit for outliers. After that, we calculate Q3 + 1.5*IQR to find upper limit for outliers. Then, we use subset() function to eliminate outliers.
data <- iris[,1:4]
dim(data)
## [1] 150   4

quartiles <- quantile(data$Sepal.Width, probs=c(.25, .75), na.rm = FALSE)
IQR <- IQR(data$Sepal.Width)

Lower <- quartiles[1] - 1.5*IQR
Upper <- quartiles[2] + 1.5*IQR

data_no_outlier <- subset(data, data$Sepal.Width > Lower & data$Sepal.Width < Upper)

dim(data_no_outlier)
## [1] 146   4
After removing the outliers in sepal width variable, we have 146 observations left.

Check Out: How to Test for Identifying Outliers in R
2) How to Remove Outliers from a Single Variable in R
In this section, we use only sepal width variable as a single variable. We have 150 observations. There exist two ways of removing outliers from a variable. Firstly, we find first (Q1) and third (Q3) quartiles. Then, we find interquartile range (IQR) by IQR() function. In addition, we calculate Q1 – 1.5*IQR to find lower limit and Q3 + 1.5*IQR to find upper limit for outliers. Then, we use subset() function to remove outliers.
data <- iris[,2]
length(data)
## [1] 150

quartiles <- quantile(data, probs=c(.25, .75), na.rm = FALSE)
IQR <- IQR(data)

Lower <- quartiles[1] - 1.5*IQR
Upper <- quartiles[2] + 1.5*IQR

data_no_outlier <- subset(data, data > Lower & data < Upper)

length(data_no_outlier)
## [1] 146
Also Check: How to Handle Missing Values in R
Secondly, we use boxplot() function to detect which values are outliers. Then, the outliers are removed by using which() function.
data <- iris[,2]
length(data)
## [1] 150

boxplot(data, plot = FALSE)$out
## [1] 4.4 4.1 4.2 2.0

outliers <- boxplot(data, plot = FALSE)$out
data_no_outlier <- data[-which(data %in% outliers)]

boxplot(data_no_outlier, plot = FALSE)$out
## numeric(0)

length(data_no_outlier)
## [1] 146
Also Check: How to Recode Character Variables in R
3) How to Remove Outliers by Group in R
In this part, we use petal width and species variables from iris data as an illustrative example.

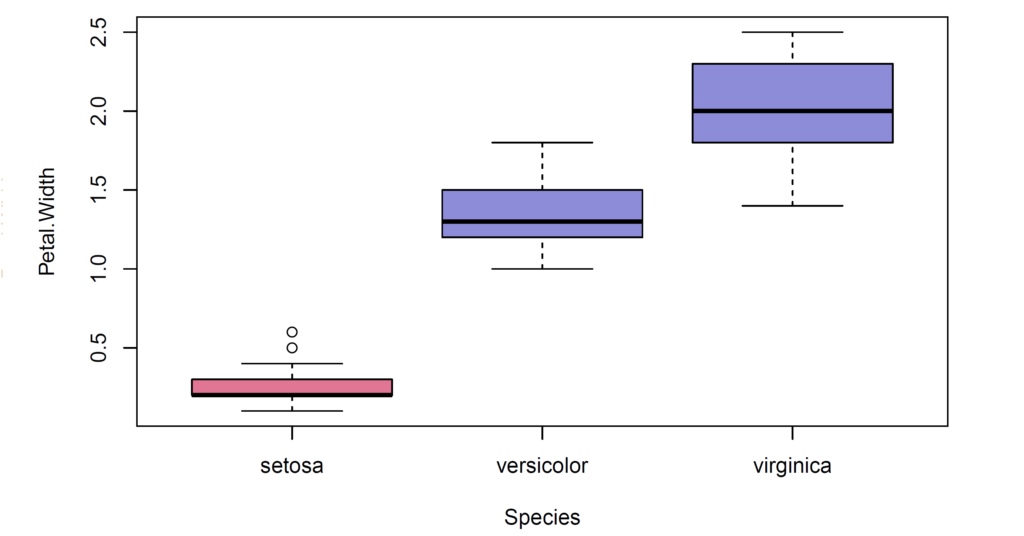
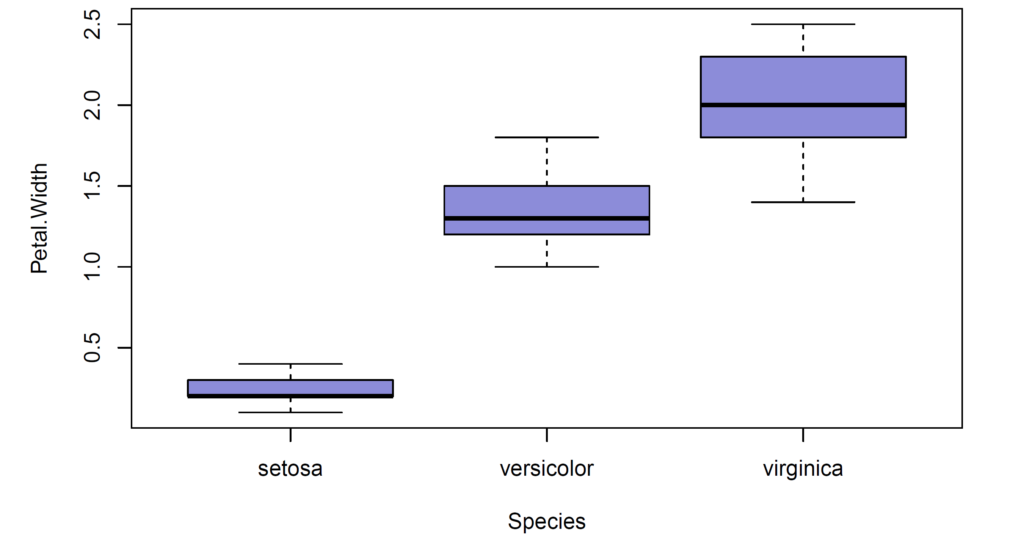
In our case, we have 50 observations in each iris species. There exist two outliers seen in petal width variable of setosa group. We use tapply() function (in which quantile() function is used) to find quantiles of each iris species. Then, we select the first (Q1) and third (Q3) quartiles of each group by using sapply() function. Interquartile range (IQR) of each group is found by tapply() function (in which IQR() function is used). Then, we calculate lower and upper limits of each group for outliers. After that, we split data by species using split() function. Then, we utilize subset() function to remove outliers and combine splitted data after removal of outliers in for loop.
data <- iris[,c(4,5)]
dim(data)
## [1] 150   2

list_quantiles <- tapply(data$Petal.Width, data$Species, quantile)

Q1s <- sapply(1:3, function(i) list_quantiles[[i]][2])
Q3s <- sapply(1:3, function(i) list_quantiles[[i]][4])

IQRs <- tapply(data$Petal.Width, data$Species, IQR)

Lowers <- Q1s - 1.5*IQRs
Uppers <- Q3s + 1.5*IQRs

datas <- split(data, data$Species)

data_no_outlier <- NULL
for (i in 1:3){
out <- subset(datas[[i]], datas[[i]]$Petal.Width > Lowers[i] & datas[[i]]$Petal.Width < Uppers[i])
data_no_outlier <- rbind(data_no_outlier, out)
}

dim(data_no_outlier)
## [1] 148   2
After removal of two outliers in setosa group, there exist 148 observations.

The application of the codes is available in our youtube channel below.
Don’t forget to check: How to Categorize Numeric Variables in R

0 Comments
8 Pingbacks