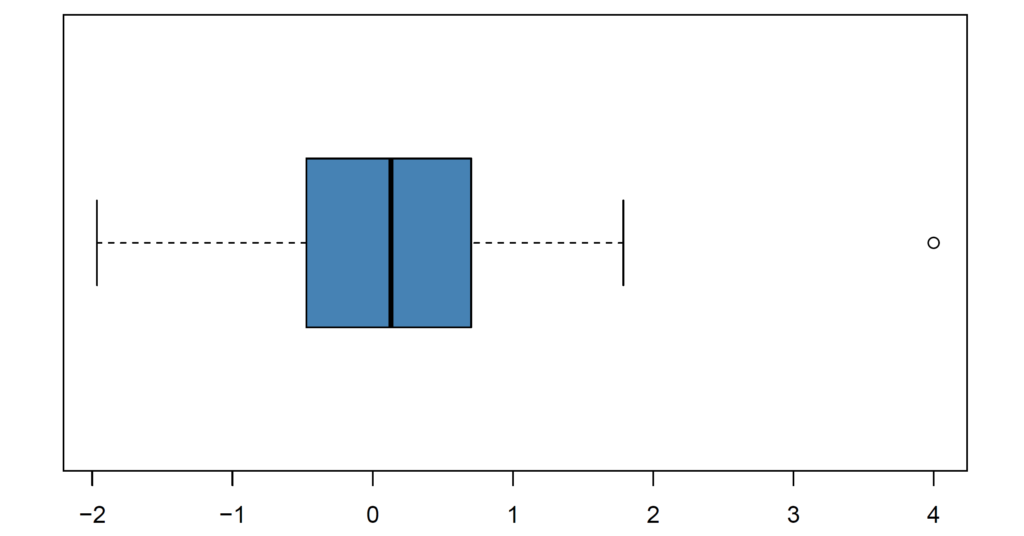
Identifying outliers is essential part while analyzing data since they significantly affect a statistical model. This inclusive tutorial covers four tests for detection of outliers. Find out how to test for identifying outliers in R.
Detection of outliers is an important process to consider the effect of possible outliers on a statistical method. In this tutorial, we will work on four methods in R to test whether outliers are present or not. Firstly, we will test outliers with chi-squared test. Secondly, we will learn how to apply for Dixon test to identify outliers. Thirdly, we use Grubbs test to test whether outliers are present in data. Last, we will perform Rosner’s test to detect the outliers in R.
Chi-squared, Dixon and Grubbs tests are available in outliers R package (Komsta, 2011). Rosner’s test can be reached from EnvStats package (Millard, 2013) in R.
In this tutorial, we simulate an example dataset from normal distribution and also add an outlier (4) for illustrative purpose. We set seed to 123 for reproducibility of results.
set.seed(123)
data <- c(rnorm(20), 4)
data
##  [1] -0.56047565 -0.23017749  1.55870831  0.07050839  0.12928774
##  [6]  1.71506499  0.46091621 -1.26506123 -0.68685285 -0.44566197
## [11]  1.22408180  0.35981383  0.40077145  0.11068272 -0.55584113
## [16]  1.78691314  0.49785048 -1.96661716  0.70135590 -0.47279141
## [21]  4.00000000

Check Out: How to Remove Outliers from Data in R
1. Chi-squared Test for Outlier in R
In this part, we learn how to perform chi-squared test for identifying outliers in R. Chisquare test is used to test outliers in right and left tails of data, separately. Default is set to test the outliers in the right tail of the data.
library(outliers)
chisq.out.test(data)
##         chi-squared test for outlier
##
## data:  data
## X-squared = 8.3991, p-value = 0.003754
## alternative hypothesis: highest value 4 is an outlier
According to chi-squared test, there is an outlier (highest value 4) in right tail of data since p-value (0.003754) is lower than 0.05. If opposite argument is set to TRUE, it tests the outlier in the left tail of the data.
library(outliers)
chisq.out.test(data, opposite = TRUE)
##         chi-squared test for outlier
##
## data:  data
## X-squared = 3.2675, p-value = 0.07066
## alternative hypothesis: lowest value -1.96661715662964 is an outlier
Chi-squared test states that there is no statistically significant evidence to reject null hypothesis (no outlier in left tail of data) since p-value (0.07066) is larger than 0.05. That is, there is no outlier in left tail of the data.
Also Check: How to Categorize Numeric Variables in R
2. Dixon Test for Outlier in R
In this section, we learn how to use Dixon test for detection of outliers in R. We apply Dixon test to detect outliers in right and left tails of data, separately. Default is set to test the outliers in the right tail of the data.
library(outliers)
dixon.test(data)
##         Dixon test for outliers
##
## data:  data
## Q = 0.48752, p-value = 0.04299
## alternative hypothesis: highest value 4 is an outlier
According to Dixon test, there is enough evidence to reject the null hypothesis (no outlier in right tail of data) since p-value (0.04299) is lower than 0.05. That means there is an outlier (highest value 4) in the right tail of data. If opposite argument is set to TRUE, it tests the outlier in the left tail of the data.
library(outliers)
dixon.test(data, opposite = TRUE)
##         Dixon test for outliers
##
## data:  data
## Q = 0.3476, p-value = 0.3362
## alternative hypothesis: lowest value -1.96661715662964 is an outlier
Dixon test suggests that there is no statistically significant evidence to reject null hypothesis (no outlier in left tail of data) since p-value (0.3362) is larger than 0.05. That is, there is no outlier in left tail of the data.
Also Check: How to Handle Missing Values in R
3. Grubbs Test for Outlier in R
In this part, we learn how to perform Grubbs test to identify outliers in R. Firstly, we apply Grubbs test whether there exist an outlier in right of data. Then, we perform Grubbs test for detection of an outlier in the left tail of the data.
library(outliers)
grubbs.test(data)
##         Grubbs test for one outlier
##
## data:  data
## G = 2.89811, U = 0.55905, p-value = 0.0108
## alternative hypothesis: highest value 4 is an outlier
According to Grubbs test results, there is an outlier (highest value 4) in right tail of data since p-value (0.0108) is lower than 0.05.
After checking the outlier in the right tail of the data, we tests the outlier in the left tail of the data by setting opposite = TRUE.
library(outliers)
grubbs.test(data, opposite = TRUE)
##         Grubbs test for one outlier
##
## data:  data
## G = 1.80763, U = 0.82845, p-value = 0.6505
## alternative hypothesis: lowest value -1.96661715662964 is an outlier
Grubbs test states that there is no statistically significant evidence to reject null hypothesis (no outlier in left tail of data) since p-value (0.6505) is larger than 0.05. That means there is no outlier in left tail of the data.
4. Rosner’s Test for Outlier in R
Rosner’s test enables to test multiple observations for possibility of outlier in order.
library(EnvStats)
rosnerTest(data)$all.stats
##   i    Mean.i      SD.i     Value Obs.Num    R.i+1 lambda.i+1 Outlier
## 1 0 0.3253560 1.2679440  4.000000      21 2.898112   2.733780    TRUE
## 2 1 0.1416238 0.9726653 -1.966617      18 2.167489   2.708246   FALSE
## 3 2 0.2525839 0.8594852  1.786913      16 1.785172   2.680931   FALSE
According to Rosner’s test results, the observation (4) is an outlier. There is no other outliers in the dataset.
The application of the codes is available in our youtube channel below.
Don’t forget to check: How to Clean Data in R
References
Komsta, L. (2011). outliers: Tests for outliers. R package version 0.14.
Millard, S.P. (2013). EnvStats: An R Package for Environmental Statistics. Springer, New York.

0 Comments
2 Pingbacks