Changing legend position may be a requirement while reporting a figure. This ultimate tutorial involves the ways of changing the legend place in ggplot2. Find out how to change legend position of a ggplot in R.
In this tutorial, we will work on the ways of changing the ggplot legend position. We use legend.position argument of theme() function available in ggplot2 package (Wickham, 2016). In this guide, we learn how to change legend place. We cover five ways of legend position in ggplot2.
- Legend on top
- Legend on bottom
- Legend on left
- Legend on right
- Legend with coordinates
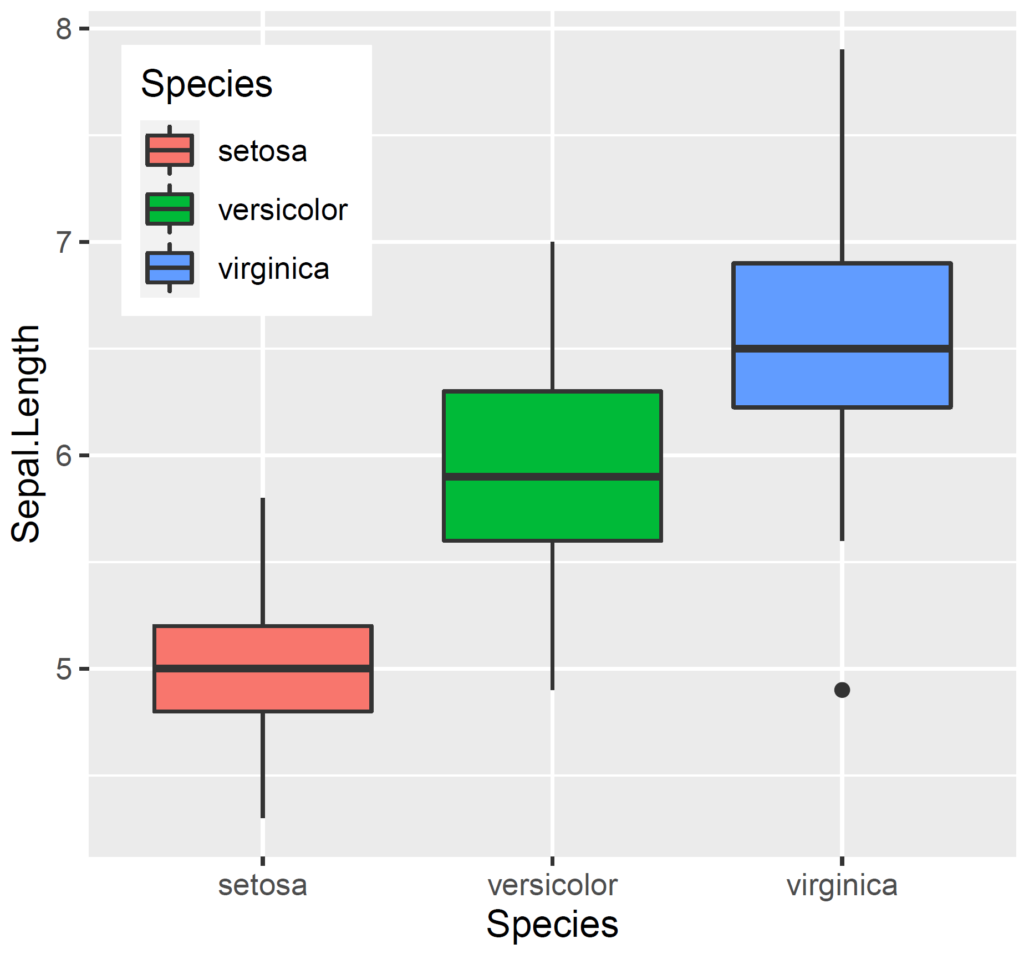
We will use iris data for implementation. We take sepal length as a response and species as a grouping variable. Let’s first draw a box-and-whisker plot with ggplot2.
library(ggplot2)
out <- ggplot(iris, aes(x = Species, y = Sepal.Length, fill = Species)) + geom_boxplot()
out

Check Out: How to Categorize Numeric Variables in R
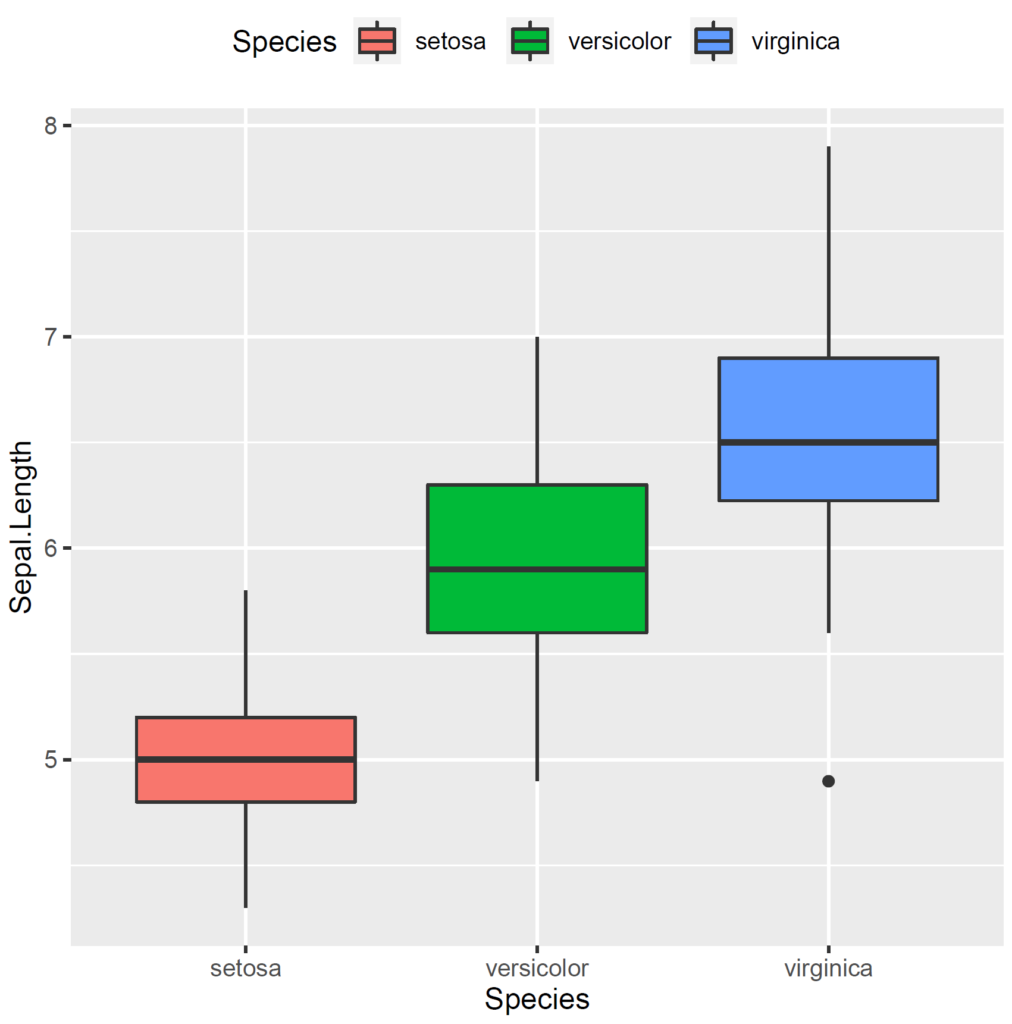
How to Change Legend Position to Top in ggplot2
We add to out object theme function in which legend argument is set to “top”.
out + theme(legend.position = "top")
Also Check: How to Recode Character Variables in R
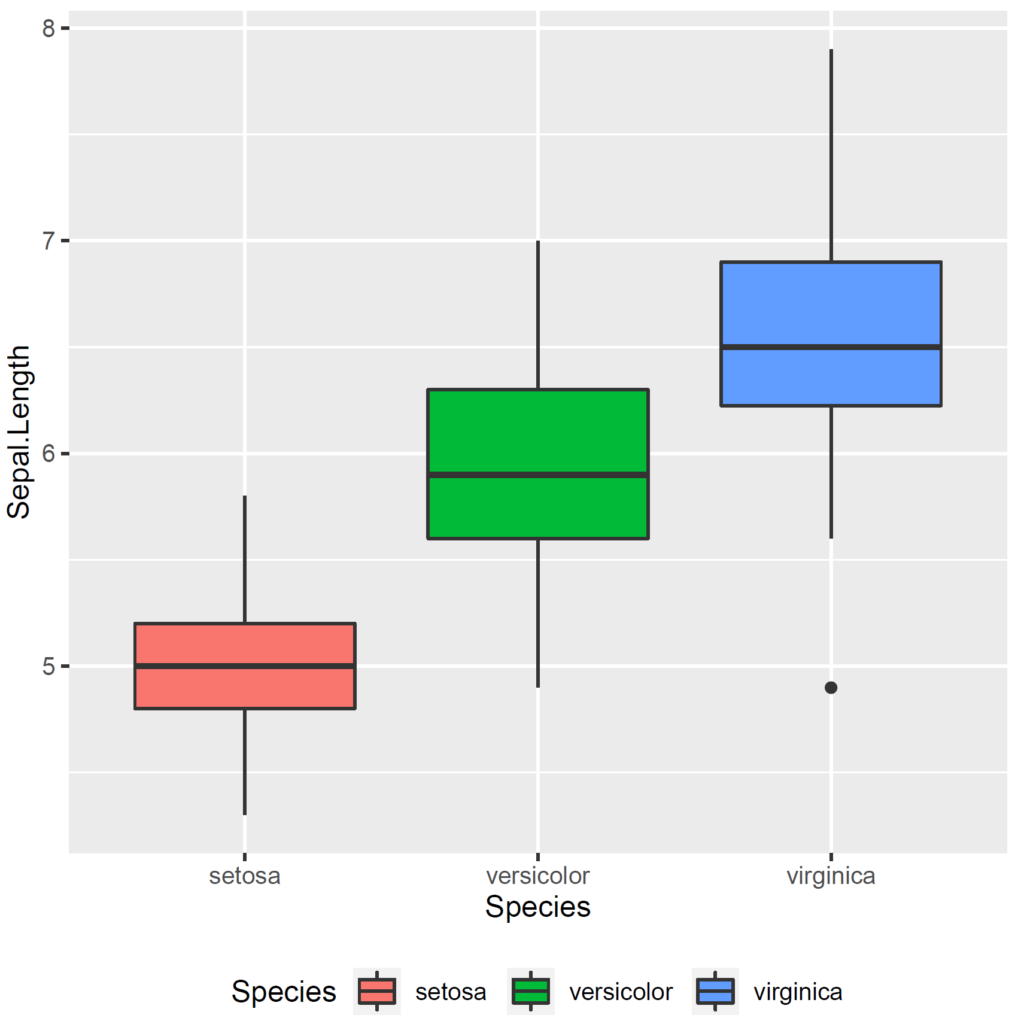
How to Change Legend Position to Bottom in ggplot2
We add to out object theme function in which legend argument is set to “bottom”.
out + theme(legend.position = "bottom")
Also Check: How to Handle Missing Values in R
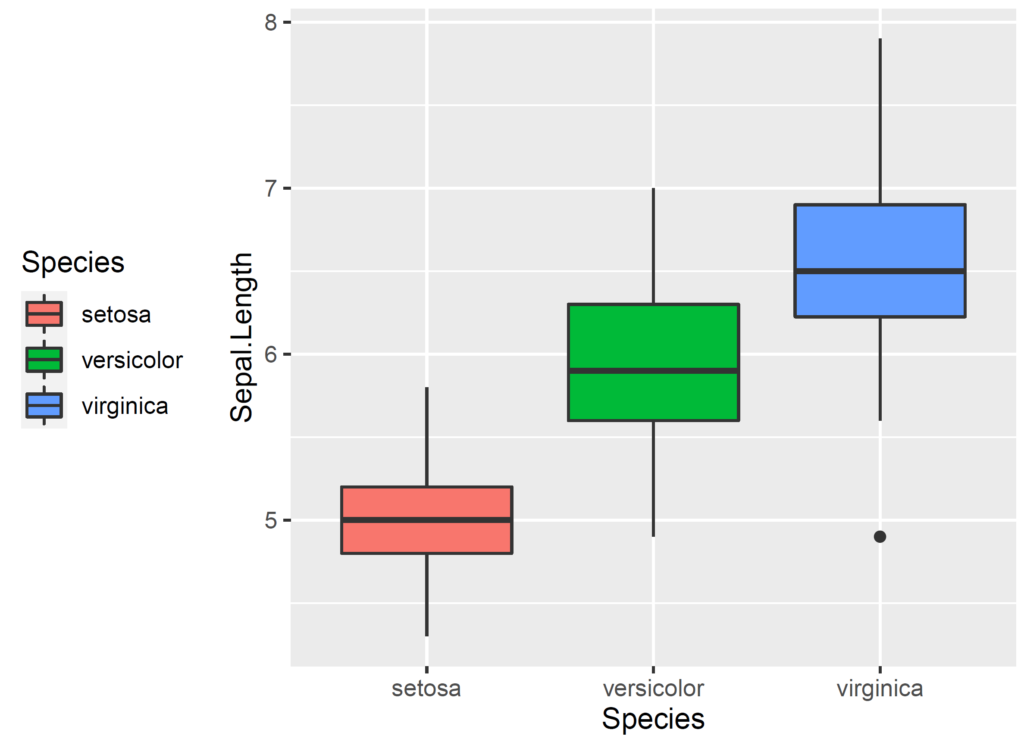
How to Change Legend Position to Left in ggplot2
We add to out object theme function in which legend argument is set to “left”.
out + theme(legend.position = "left")
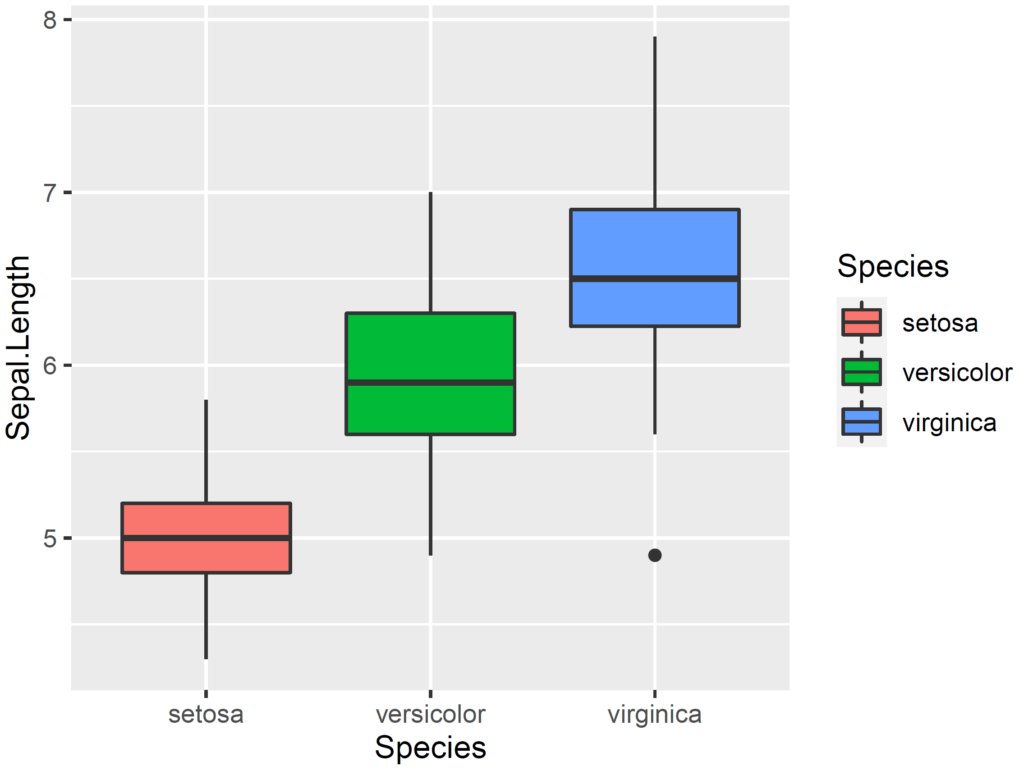
How to Change Legend Position to Right in ggplot2
We add to out object theme function in which legend argument is set to “right”.
out + theme(legend.position = "right")
How to Change Legend Position Using Coordinates in ggplot2
We add to out object theme function in which legend argument is set to a coordinate. In our example, we set to c(0.2, 0.8).
out + theme(legend.position = c(0.2, 0.8))
The application of the codes is available in our youtube channel below.
Don’t forget to check: How to Clean Data in R
References
Wickham, H. (2016). ggplot2: Elegant Graphics for Data Analysis. Springer-Verlag New York.

Leave a Reply