Sometimes, there may exist multimodal data while analyzing data. This ultimate tutorial includes detection of multimodal data. Find out how to determine whether data are unimodal or multimodal in R.
In this guide, we will work on data modality in R. Firstly, we will determine modality of data. Secondly, we will obtain modes of multimodal data. Thirdly, we will obtain parameters of distributions for bimodal data. Last, we will obtain cutoff for bimodal data.
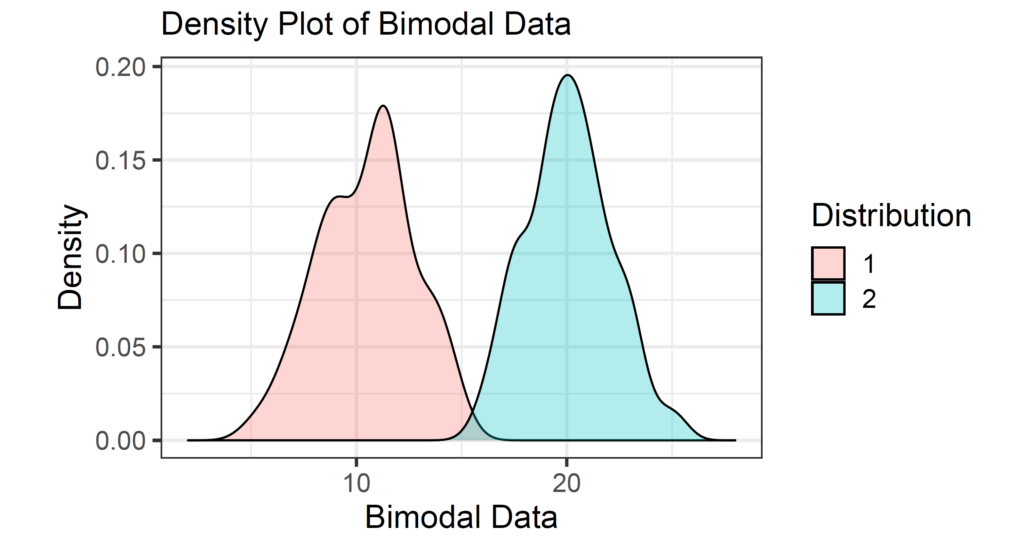
In this part, we will generate bimodal data from normal distribution with different means by setting seed to 12345 for reproducibility of outputs.
set.seed(12345)
data <- c(rnorm(100,10,2), rnorm(100,20,2))
1. How to Determine Modality of Data in R
In this section, we work on detection of data modality in R. Firstly, we determine whether data are unimodal. Then, we detect whether data are bimodal. Last, we check that data are trimodal.
1.1. How to Determine If Data are Unimodal in R
First things first, it is important to decide if distribution is unimodal or not. For this purpose, there exist three ways of detecting unimodality of data. Firstly, we conduct Hartigans’ dip test for unimodality or multimodality with dip.test() function available in diptest package (Maechler, 2021). Secondly, we use is.modal() function available in LaplacesDemon package (Statisticat, 2021). Last, we utilize is.multimodal() function available in LaplacesDemon package (Statisticat, 2021).
library(diptest)
dip.test(data)
##
##         Hartigans' dip test for unimodality / multimodality
##
## data:  data
## D = 0.066571, p-value = 4.055e-06
## alternative hypothesis: non-unimodal, i.e., at least bimodal
According to result of Hartigans’ dip test, there is enough evidence to reject null hypothesis since p-value (4.055e-06) is smaller than alpha (0.05). That is, the data are not unimodal.
library(LaplacesDemon)
is.unimodal(data)
## [1] FALSE
The result obtained from is.unimodal() function is FALSE. That means, the data are not unimodal.
library(LaplacesDemon)
is.multimodal(data)
## [1] TRUE
The result obtained from is.multimodal() function is TRUE. That is, the data are multimodal, not unimodal.
Check Out: How to Assess Normality in R
1.2. How to Determine If Data are Bimodal in R
There exist two way of detecting bimodality of data in R. One of them is using is.bimodal() function available in LaplacesDemon package (Statisticat, 2021). The other one is the bimodality coefficient as specified in Pfister et al. (2013). This coefficient is obtained using bimodality_coefficient() function available in mousetrap package (Kieslich, 2019).
library(LaplacesDemon)
is.bimodal(data)
## [1] TRUE
The result obtained from is.bimodal() function is TRUE. That means, the data are bimodal.
library(mousetrap)
bimodality_coefficient(data)
## [1] 0.6014164
The bimodality coefficient is obtained as 0.6014164. If this value is larger than 0.555 (stated in Pfister et al., 2013), it indicates bimodality of data.
1.3. How to Determine If Data are Trimodal in R
We use is.trimodal() function available in LaplacesDemon package (Statisticat, 2021).
library(LaplacesDemon)
is.trimodal(data)
## [1] FALSE
The result obtained from is.trimodal() function is FALSE. That is, the data are not trimodal.
2. How to Obtain Modes of Multimodal Data in R
In this part, we obtain modes of multimodal data in R. We use Modes() function available in LaplacesDemon package (Statisticat, 2021). Since we have bimodal data, we have two modes.
library(LaplacesDemon)
Modes(data)$modes
## [1] 20.04672 10.73832
Also Check: How to Clean Data in R
3. How to Obtain Parameters of Distributions for Bimodal Data in R
In this section, we obtain the parameters of distributions for binomial data in R. We include cutoff package (Choisy, 2015) available in github. We need to install this package from github with install_github() function available in devtools package (Wickham, 2021).
After installing and loading cutoff package (Choisy, 2015), we use expectation-maximization estimation of a finite mixture model with em() function available in cutoff package. It requires two distributions for bimodal data. Therefore, we include “normal” for first and second distributions. Then, we obtain the parameters of distributions for binomial data with confint() function.
library(devtools)
install_github("choisy/cutoff")
library(cutoff)

out <- em(data,"normal","normal")
confint(out)
## Profiling...
##
##          Estimate      2.5 %     97.5 %
## mu1    10.5028481 10.0579338 10.9512059
## sigma1  2.2326975  1.9502254  2.5890571
## mu2    20.0972113 19.6932875 20.4985893
## sigma2  2.0093011  1.7542979  2.3304956
## lambda  0.5016648  0.4323734  0.5709563
According to the results obtained from confint() function, it returns mean and standard deviation. Also, it returns the probability to belong to first distribution. Moreover, there exists confidence interval for the estimations.
Also Check: Shapiro-Wilk Test for Univariate and Multivariate Normality in R
4. How to Obtain Cutoff for Bimodal Data in R
We use cutoff() function available in cutoff package (Choisy, 2015) to obtain bimodal data in R. It also returns confidence interval for the estimation.
cutoff(out)
## Estimate    2.5 %   97.5 %
## 16.85687 16.66146 17.05228
The application of the codes is available in our youtube channel below.
Don’t forget to check: How to Handle Missing Values in R
References
Choisy, M. (2015). cutoff: Identify a cutoff value from bimodal data. R package version 0.1.0.
Kieslich, P.J., Henninger, F., Wulff, D.U., Haslbeck, J.M.B., Schulte-Mecklenbeck, M. (2019). Mouse-tracking: A practical guide to implementation and analysis. In M. Schulte-Mecklenbeck, A. Kühberger, J. G. Johnson (Eds.), A Handbook of Process Tracing Methods (pp. 111-130). New York, NY: Routledge.
Maechler, M. (2021). diptest: Hartigan’s Dip Test Statistic for Unimodality – Corrected. R package version 0.76-0.
Pfister, R., Schwarz, K.A., Janczyk, M., Dale, R., Freeman, J.B. (2013). Good things peak in pairs: A note on the bimodality coefficient. Frontiers in Psychology, 4, 700.
Statisticat, LLC. (2021). LaplacesDemon: Complete Environment for Bayesian Inference. Bayesian-Inference.com. R package version 16.1.6.
Wickham, H., Hester, J., Chang, W. (2021). devtools: Tools to Make Developing R Packages Easier. R package version 2.4.2.

Leave a Reply