Normality has an essential role since the most of the statistical methods are based on normal distribution. This ultimate guide includes the ways of checking normality. Find out how to assess normality in R.
In this guide, we will work on three ways of assessing normality in R. Firstly, we will work on visual methods for assessing normality. Then, we will present the most well-known normality tests available in R. Last, we will go through case of large sample size.
In this part, we will use iris data set available in R. Firstly, let’s construct our data set we will work on. We work on sepal length of setosa type (one of iris types).
data <- iris$Sepal.Length[1:50]
Visual Methods for Assessing Normality
In this part, we work on visual methods to assess normality in R. There exist two main graphics of assessing the distribution; namely, density plot and Q-Q plot.
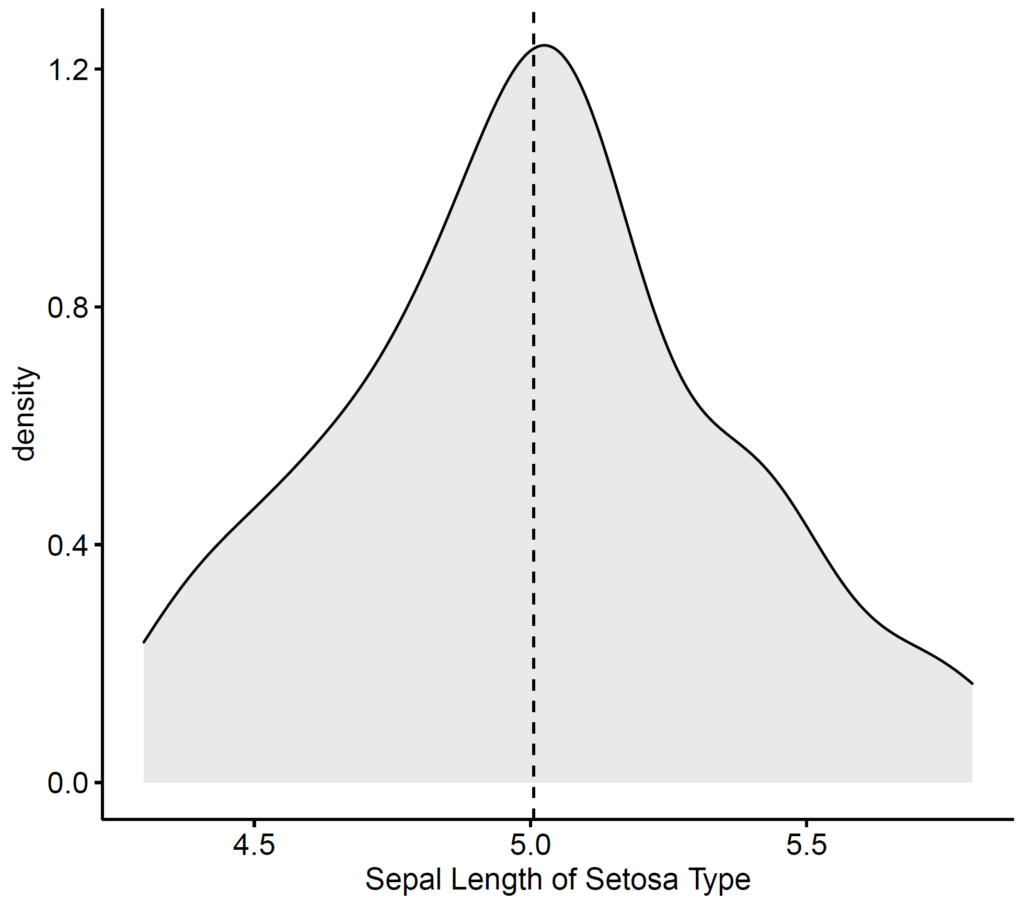
1. Density Plot
Density plot provides a visual assessment about whether the distribution is bell shaped or not. We use ggdensity() function available in ggpubr package (Kassambara, 2020).
ggpubr::ggdensity(data, fill = "lightgray", add = "mean", xlab = "Sepal Length of Setosa Type")
Check Out: Shapiro-Wilk Test for Univariate and Multivariate Normality in R
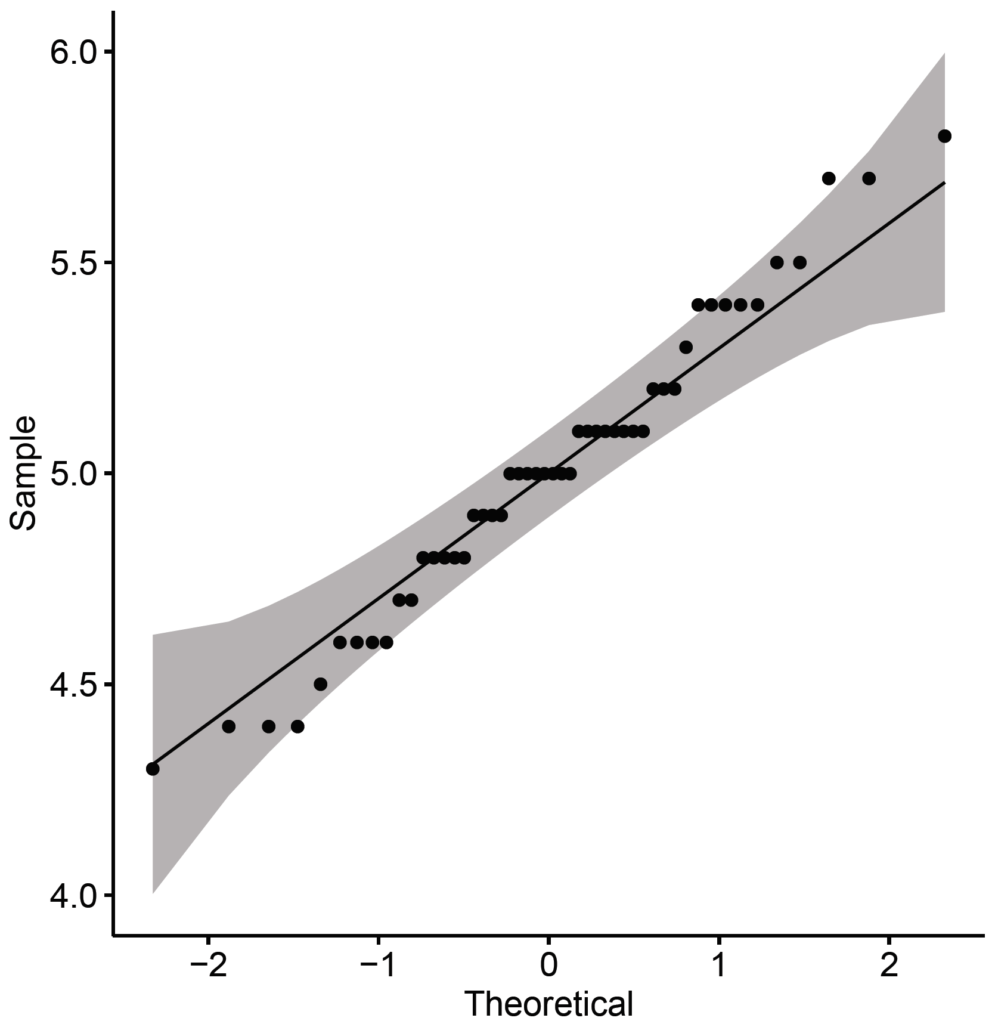
2. Q-Q Plot
Q-Q plot (Quantile-Quantile plot) is drawn between given sample and normal distribution. A 45-degree reference line is also plotted to assess how close sample values are to normal distribution. To draw Q-Q plot, we use ggqqplot() function available in ggpubr package (Kassambara, 2020).
ggpubr::ggqqplot(data)
Normality Tests
In this part, we go through seven well-known normality tests in R. The following is the list of these tests.
- Shapiro-Wilk test
- Jarque-Bera test
- Anderson-Darling test
- Cramer-von Mises test
- Lilliefors (Kolmogorov-Smirnov) test
- Pearson chi-square test
- Shapiro-Francia test
1. Shapiro-Wilk Test for Normality
We use shapiro.test() function to check the normality of data with Shapiro-Wilk test.
shapiro.test(data)
##
##         Shapiro-Wilk normality test
##
## data:  data
## W = 0.9777, p-value = 0.4595
According to the result of Shapiro-Wilk test, there is no enough evidence to reject null hypothesis (Ho: Data are normally distributed) since p-value (0.4595) is larger than alpha (0.05). Therefore, we can conclude that the data are normally distributed.
Also Check: How to Handle Missing Values in R
2. Jarque-Bera Test for Normality
We use jarque.bera.test() function to check the normality of data with Jarque-Bera test available in tseries package (Trapletti and Hornik, 2019).
tseries::jarque.bera.test(data)
##
##         Jarque Bera Test
##
## data:  data
## X-squared = 0.36208, df = 2, p-value = 0.8344
Jarque-Bera test suggest that there is no enough evidence to reject null hypothesis (Ho: Data are normally distributed) since p-value (0.8344) is larger than alpha (0.05). Therefore, we can conclude that the data are normally distributed.
3. Anderson-Darling Test for Normality
To use Anderson-Darling test for assessing normality in R, we apply ad.test() function available in nortest package (Gross and Ligges, 2015).
nortest::ad.test(data)
##
##         Anderson-Darling normality test
##
## data:  data
## A = 0.40799, p-value = 0.3352
According to Anderson-Darling test, there is no enough evidence to reject null hypothesis (Ho: Data are normally distributed) since p-value (0.3352) is larger than alpha (0.05). Therefore, we can conclude that the data are normally distributed.
4. Cramer-von Mises Test for Normality
Researchers can use Cramer-von Mises test to assess normality of data with cvm.test() function available in nortest package (Gross and Ligges, 2015).
nortest::cvm.test(data)
##
##         Cramer-von Mises normality test
##
## data:  data
## W = 0.071753, p-value = 0.2597
According to Cramer-von Mises test, there is no enough evidence to reject null hypothesis (Ho: Data are normally distributed) since p-value (0.2597) is larger than alpha (0.05). Therefore, we can conclude that the data are normally distributed.
Also Check: How to Recode Character Variables in R
5. Lilliefors (Kolmogorov-Smirnov) Test for Normality
One can assess the normality via Lilliefors test with lillie.test() function available in nortest package (Gross and Ligges, 2015).
nortest::lillie.test(data)
##
##         Lilliefors (Kolmogorov-Smirnov) normality test
##
## data:  data
## D = 0.11486, p-value = 0.09693
Lilliefors test states that there is no enough evidence to reject null hypothesis (Ho: Data are normally distributed) since p-value (0.09693) is larger than alpha (0.05). Therefore, we can conclude that the data are normally distributed.
6. Pearson Chi-square Test for Normality
Researchers can use Pearson chi-square test for assessing normality with pearson.test() function available in nortest package (Gross and Ligges, 2015).
nortest::pearson.test(data)
##
##         Pearson chi-square normality test
##
## data:  data
## P = 9.2, p-value = 0.2386
We can conclude that the data are normally distributed since p-value (0.2386) is larger than alpha (0.05) according to Pearson chi-square test.
7. Shapiro-Francia Test for Normality
One can assess the normality through Shapiro-Francia test with sf.test() function available in nortest package (Gross and Ligges, 2015).
nortest::sf.test(data)
##
##         Shapiro-Francia normality test
##
## data:  data
## W = 0.9817, p-value = 0.5357
According to the results of Shapiro-Francia test, there is no enough evidence to reject null hypothesis (Ho: Data are normally distributed) since p-value (0.5357) is larger than alpha (0.05). Therefore, we can conclude that the data are normally distributed.
Case of Large Sample Size
According to Central Limit Theorem, no matter what distribution is, the sampling distribution of mean tends to be normal if the sample is large enough (n ≥ 30). It is important to note that sample size in each group must be large enough. In such a case, normality is not needed to be met since the sampling distribution is normal.
The application of the codes is available in our youtube channel below.
Don’t forget to check: How to Categorize Numeric Variables in R
References
Gross, J., Ligges, U. (2015). nortest: Tests for Normality. R package version 1.0-4.
Kassambara, A. (2020). ggpubr: ‘ggplot2’ Based Publication Ready Plots. R package version 0.4.0.
Trapletti, A., Hornik, K. (2019). tseries: Time Series Analysis and Computational Finance. R package version 0.10-47.

0 Comments
6 Pingbacks