One-way ANOVA is the statistical procedure to test the equality of k independent population means. This comherensive tutorial includes Box-Cox transformation for non-normal and heteroscedastic data to use one-way ANOVA. Find out how to apply one-way ANOVA for non-normal and heteroscedastic data in R.
In this tutorial, we will work on non-normal and heteroscedastic data in R. Firstly, we will check the normality of data in each group. Secondly, we will assess the homogeneity of variance. Thirdly, we will apply Box-Cox transformation to convert data to normal and homoscedastic one. Then, we will conduct one-way ANOVA and pairwise comparison. Last, we will find mean and confidence interval for back-transformed data.
In this part, we will use AADT dataset available in AID package (Dag and Ilk, 2017).
library(AID)
data(AADT)
Before we go ahead, let’s obtain descriptive statistics for each group with describe() function available in onewaytests (Dag et al., 2018 ).
library(onewaytests)
describe(aadt ~ class, data = AADT)
##                      n      Mean   Std.Dev  Median   Min    Max    25th     75th  Skewness Kurtosis NA
## rural interstate     8 18593.125 10384.748 17688.0  5697  40642 12562.0  21007.5 1.1026726 3.753741  0
## rural noninterstate 56  3464.554  4036.491  1642.5   201  16567   807.5   4321.0 1.6477736 4.666493  0
## urban interstate    18 74310.000 42846.847 73505.0 22165 155547 34982.0 102084.8 0.3805963 1.872645  0
## urban noninterstate 39 17221.026 14665.216 15334.0  1266  78343  5601.0  21748.0 2.0823766 9.020920  0
Check Out: How to Assess Normality in R
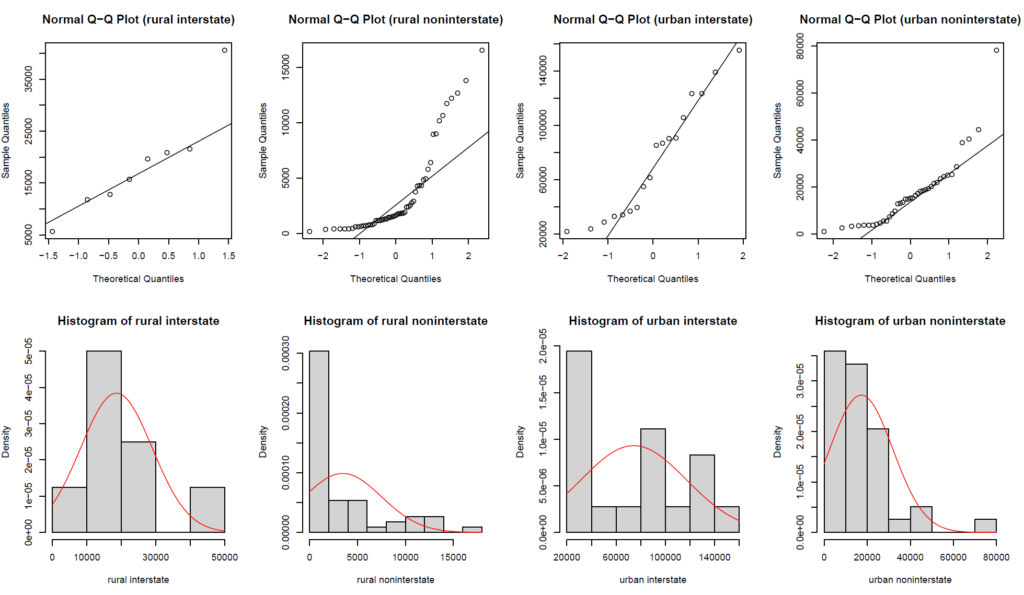
1. Assessing Normality of Data in R
In this section, we use nor.test() function available in onewaytests package (Dag et al., 2018) in R.
nor.test(aadt ~ class, data = AADT)
##
##   Shapiro-Wilk Normality Test (alpha = 0.05)
## ---------------------------------------------------------
##   data : aadt and class
##
##                 Level Statistic      p.value   Normality
## 1    rural interstate 0.8854088 2.119676e-01  Not reject
## 2 rural noninterstate 0.7374816 1.146048e-08      Reject
## 3    urban interstate 0.9171534 1.151042e-01  Not reject
## 4 urban noninterstate 0.8076274 1.211758e-05      Reject
## ---------------------------------------------------------
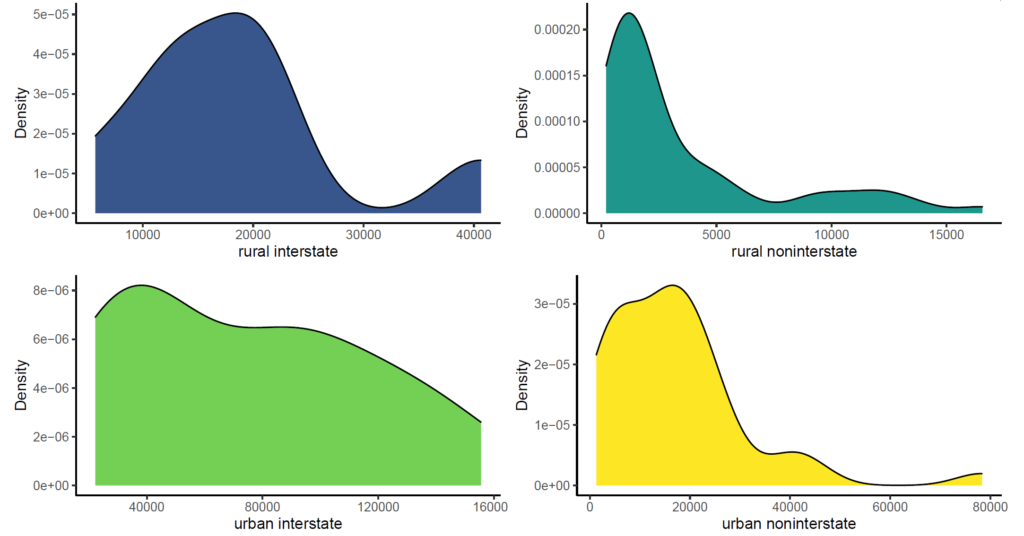
According to Shapiro-Wilk normality test results, the data for rural/urban noninterstate are not normally distributed since the corresponding p-values are smaller than alpha (0.05).
Also Check: Shapiro-Wilk Test for Univariate and Multivariate Normality in R
2. Assessing Homogeneity of Variance in R
In this part, we assess homogeneity of variance with Fligner-Killeen homogeneity test in R since it is very robust against departures from normality. We use homog.test() function available in onewaytests package (Dag et al., 2018). We need to set method argument to “Fligner”.
homog.test(aadt ~ class, data = AADT, method = "Fligner")
##
##   Fligner-Killeen Homogeneity Test (alpha = 0.05)
## ---------------------------------------------------
##   data : aadt and class
##
##   statistic  : 70.66352
##   parameter  : 3
##   p.value    : 3.077296e-15
##
##   Result     : Variances are not homogeneous.
## ---------------------------------------------------
According to Fligner-Killeen homogeneity test results, there is enough evidence to reject null hypothesis (Ho: Variances are homogeneous) since p-value (3.077296e-15) is lower than alpha (0.05). Therefore, the variances among groups are not homogeneous.
3. How to Apply Box-Cox Transformation for One-way ANOVA in R
We use boxcoxfr() function available in AID package (Dag and Ilk, 2017) to apply Box-Cox transformation for one-way ANOVA in R.
out <- boxcoxfr(AADT$aadt, AADT$class)
##
##   Box-Cox power transformation
## ---------------------------------------------------------------------
##   data : AADT$aadt and AADT$class
##
##   lambda.hat : 0.07
##
##
##   Shapiro-Wilk normality test for transformed data (alpha = 0.05)
## -------------------------------------------------------------------
##                 Level statistic    p.value Normality
## 1    rural interstate 0.9616863 0.82600329       YES
## 2 rural noninterstate 0.9583807 0.05108728       YES
## 3    urban interstate 0.9259602 0.16481355       YES
## 4 urban noninterstate 0.9636063 0.23477931       YES
##
##
##   Bartlett's homogeneity test for transformed data (alpha = 0.05)
## -------------------------------------------------------------------
##   Level statistic   p.value Homogeneity
## 1   All  4.257035 0.2350132         YES
## ---------------------------------------------------------------------
Normality of data in each group is assessed by Shapiro-Wilk test. According to Shapiro-Wilk test results, there is no enough evidence to reject the normality of average annual daily traffic in each group since all p-values are greater than alpha (0.05). Homogeneity of variance is assessed via Bartlett test since data are normally distributed. Bartlett test suggests the homogeneity of variance since p-value (0.2350132) is greater than alpha (0.05).
Also Check: Box-Cox Transformation for Normalizing a Non-normal Variable in R
4. One-way ANOVA in R
We can apply one-way ANOVA for transformed data. We use aov.test() function available in onewaytests package (Dag et al., 2018).
AADT$tf.aadt <- out$tf.data
result<-aov.test(tf.aadt ~ class, data = AADT)
##
##   One-Way Analysis of Variance (alpha = 0.05)
## -------------------------------------------------------------
##   data : tf.aadt and class
##
##   statistic  : 77.59829
##   num df     : 3
##   denom df   : 117
##   p.value    : 1.066575e-27
##
##   Result     : Difference is statistically significant.
## -------------------------------------------------------------
ANOVA results state that there is enough evidence to reject null hypothesis (Ho: Population means are equal) since p-value (1.066575e-27) is lower than alpha (0.05). In other words, at least one group mean is statistically different from the others.
paircomp(result)
##
##   Bonferroni Correction (alpha = 0.05)
## ------------------------------------------------------------------------
##             Level (a)           Level (b)      p.value   No difference
## 1    rural interstate rural noninterstate 2.917671e-06          Reject
## 2    rural interstate    urban interstate 2.617567e-04          Reject
## 3    rural interstate urban noninterstate 1.000000e+00      Not reject
## 4 rural noninterstate    urban interstate 4.758932e-21          Reject
## 5 rural noninterstate urban noninterstate 4.728537e-13          Reject
## 6    urban interstate urban noninterstate 1.344659e-08          Reject
## ------------------------------------------------------------------------
When we make pairwise comparison with bonferroni correction, we conclude that population means of all groups are statistically different since all p-values are smaller than alpha (0.05) except for one comparison (rural interstate and urban noninterstate).
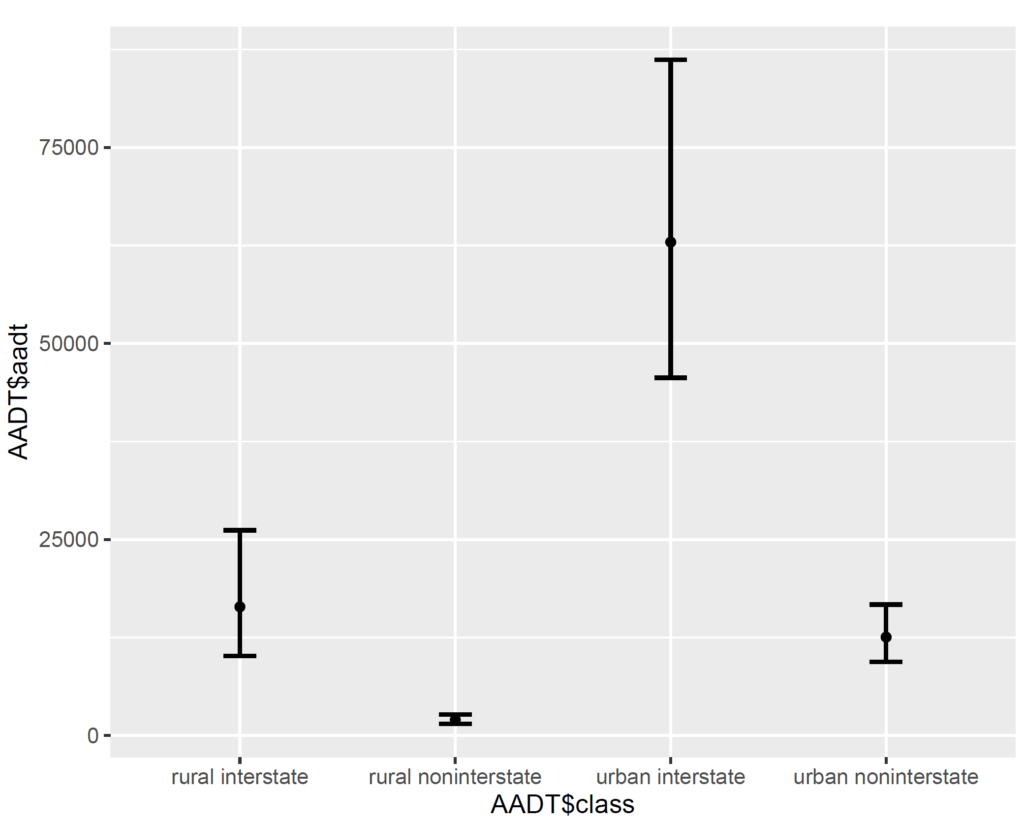
5. Mean and Confidence Interval for Back Transformed Data in R
After this process is completed, confidence interval for back transformed data needs to be reported. Of course, the confidence interval becomes asymmetric since original data in groups are not normally distributed. We use confInt() function available in AID package (Dag and Ilk, 2017).
confInt(out, level = 0.95)
##
##   Back transformed data
## --------------------------------------------------
##                          Mean      2.5%     97.5%
## rural interstate    16414.561 10136.199 26166.703
## rural noninterstate  2004.065  1484.761  2688.367
## urban interstate    62916.623 45619.722 86159.962
## urban noninterstate 12551.073  9381.990 16693.347
## --------------------------------------------------
The application of the codes is available in our youtube channel below.
Don’t forget to check: Heteroscedastic ANOVA Tests in R
References
Dag, O., Dolgun, A., Konar, N.M. (2018). onewaytests: An R Package for One-Way Tests in Independent Groups Designs. R Journal, 10(1), 175-199.
Dag, O., Ilk, O. (2017). An Algorithm for Estimating Box-Cox Transformation Parameter in ANOVA. Communications in Statistics – Simulation and Computation, 46:8, 6424-6435.

0 Comments
1 Pingback